

Explore your dashboard
This section is where the data about your business is displayed in an intuitive way. The dashboard gives you a 360 degree view of the health of your business.

Through the dashboard you get a view of :
-
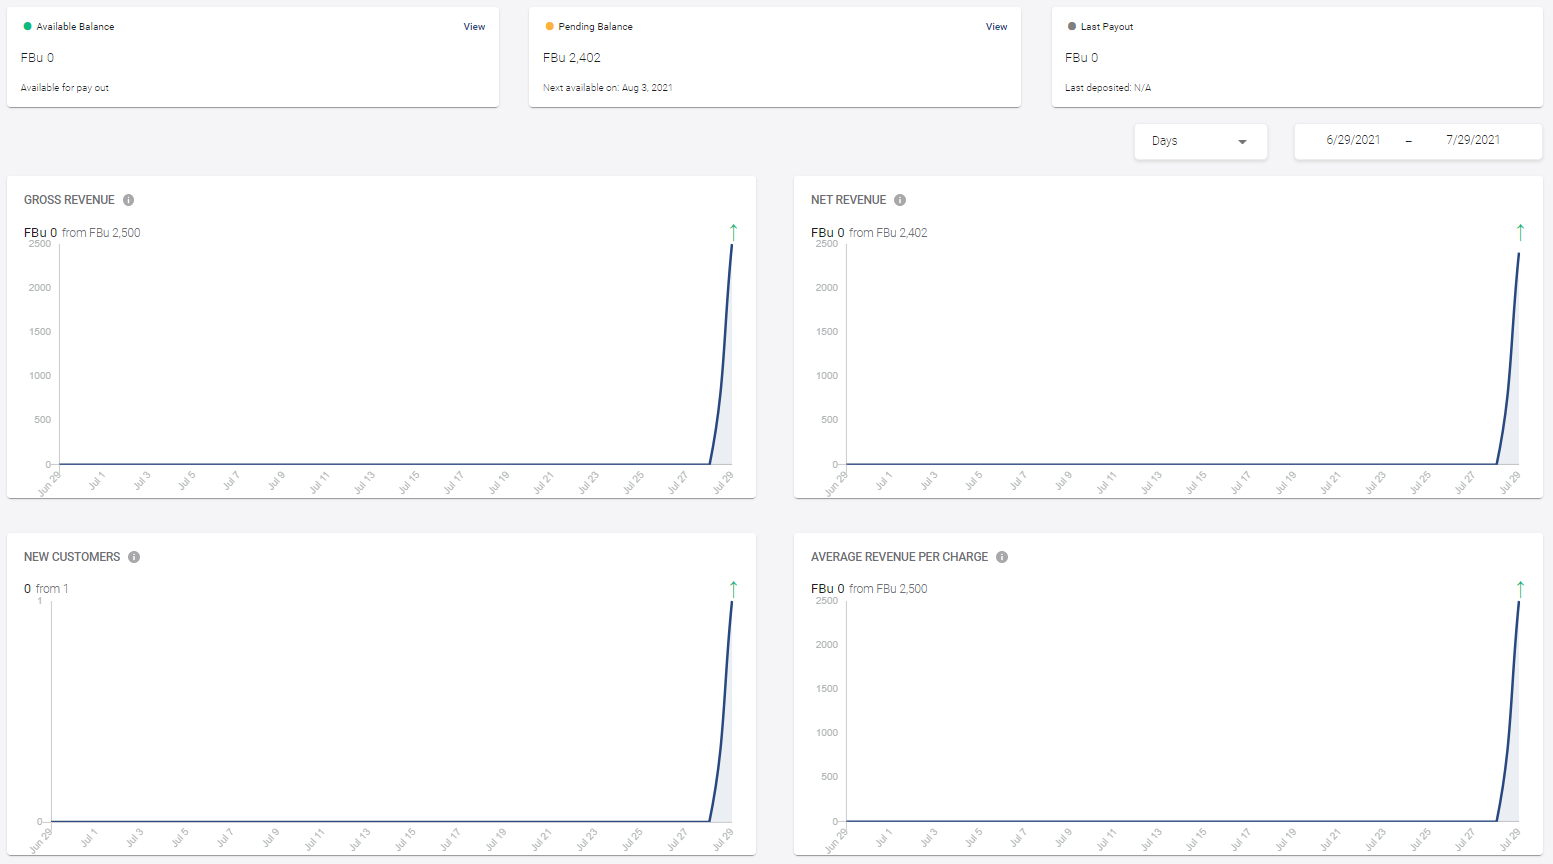
Balances: From the dashboard, you get a view of your account daily balances; Available balance and Pending balance, which helps you to make decisions based on your real time view of your finances.
-
Available balance: amount available in your account to be used, can be transferred to another merchant account or paid out to your bank account.
-
Pending balance: amount of money expected to be available in your account in near future.
-
-
Payouts: From the dashboard you have a view of the total amount of recently processed payouts.
-
Activities graph: From the dashboard, you get the timeline of activities,transactions and other metrics.
From this graph you can select to see:
-
Gross revenue
- Net Revenu
-
New customers
-
Average revenue per customer
-
Successful payments
-
Failed payments
-
Annual run rate
-
Refunds
-
Payouts
-
Transfers
At the top right of the graph section, you can select the interval you want to see by choosing the start date and the end date and you will get the graph of the selected timeframe.